Why Data Visualization Has Become a Strategic Asset for All Businesses
In today's data-driven world, companies are collecting more data than ever before. From sales figures to customer behavior, supply chain metrics to employee performance—everything is being measured, tracked, and stored. But raw data, by itself, is meaningless. It is only when this data is transformed into clear, visual insights that it becomes a true strategic asset.
The Age of Information Overload
Modern executives face an overwhelming amount of data on a daily basis. Spreadsheets with thousands of rows, reports filled with numbers, and dashboards that lack context can paralyze decision-making. According to a 2024 Gartner report, over 60% of business leaders say that data overload delays their decision-making process.
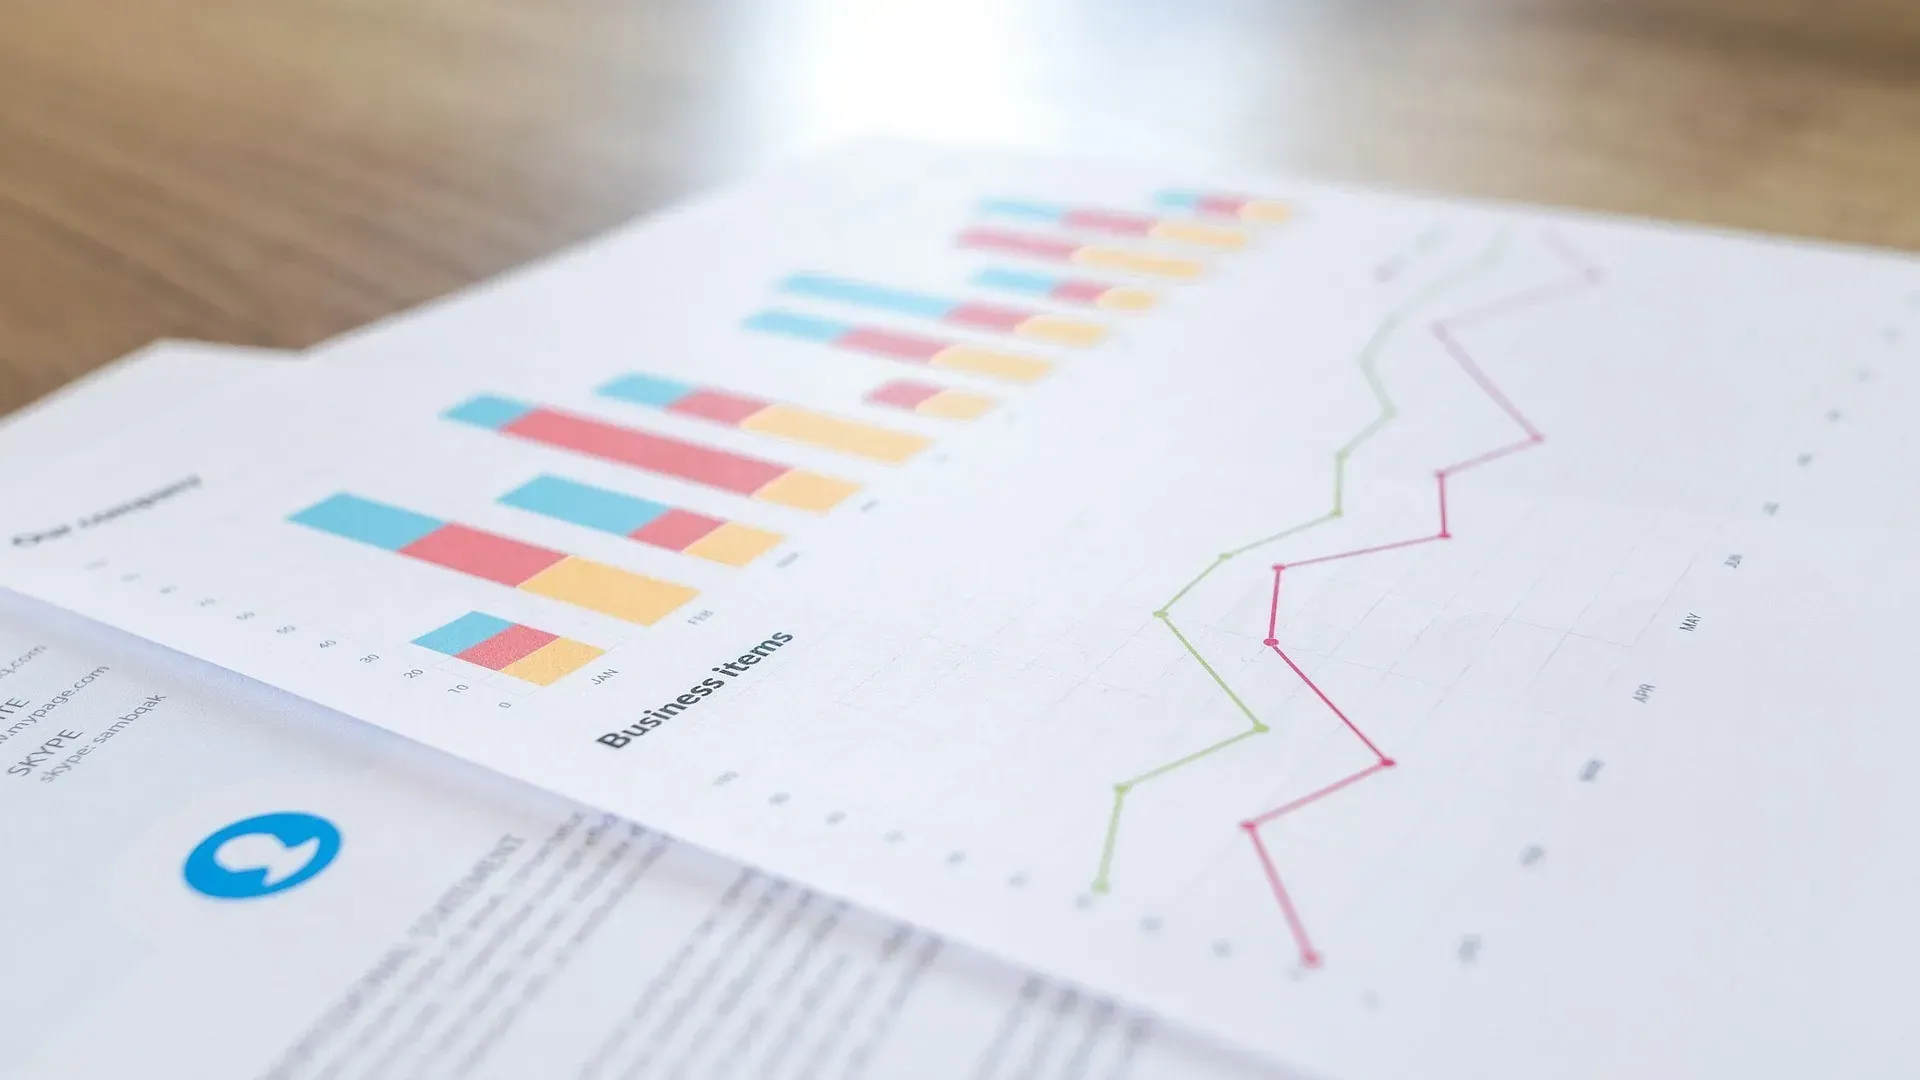
Data visualization solves this problem. It condenses large datasets into visuals that highlight patterns, trends, and anomalies—allowing decision-makers to act with confidence and speed.
From Operational to Strategic
Ten years ago, data visualization was considered a back-office function—mainly used by analysts to explain performance metrics. Today, it's a boardroom-level tool. Whether it’s a marketing director identifying ROI per campaign or a CFO tracking cost leakage, visual data enables better strategic alignment.
Competitive Advantage in a Fast-Moving Market
Speed is everything in modern business. Companies that can read the signs of change early (declining margins, shifting customer behaviors, emerging market opportunities) have a clear edge over those who wait for quarterly reports. Visualization turns your data into radar—helping you navigate uncertainty.
Visual Communication is Universal
Numbers require interpretation. Charts and graphs deliver stories. They transcend language and department silos, helping everyone from the warehouse to the boardroom understand what matters. This democratization of information fosters alignment, engagement, and action.
Conclusion
Data visualization is no longer a luxury or a technical detail. It is a fundamental requirement for any organization that wants to survive and thrive in a complex, fast-moving world. Businesses that embrace it as a strategic tool will move faster, decide smarter, and outperform their competition.


